Visualize Your Netatmo Data with Grafana
Netatmo Weather Station is the ultimate personal weather station and gives you access to your measurements both through apps and a slick web interface. In addition to that, Netatmo has Developer APIs for access to raw data. Owning a Netatmo station, I just had to try to set up a Grafana dashboard with my weather data. Grafana is both flexible and has great-looking dashboards, so it should be a good fit for weather measurements. Keep on reading for tips on how to do this yourself too!
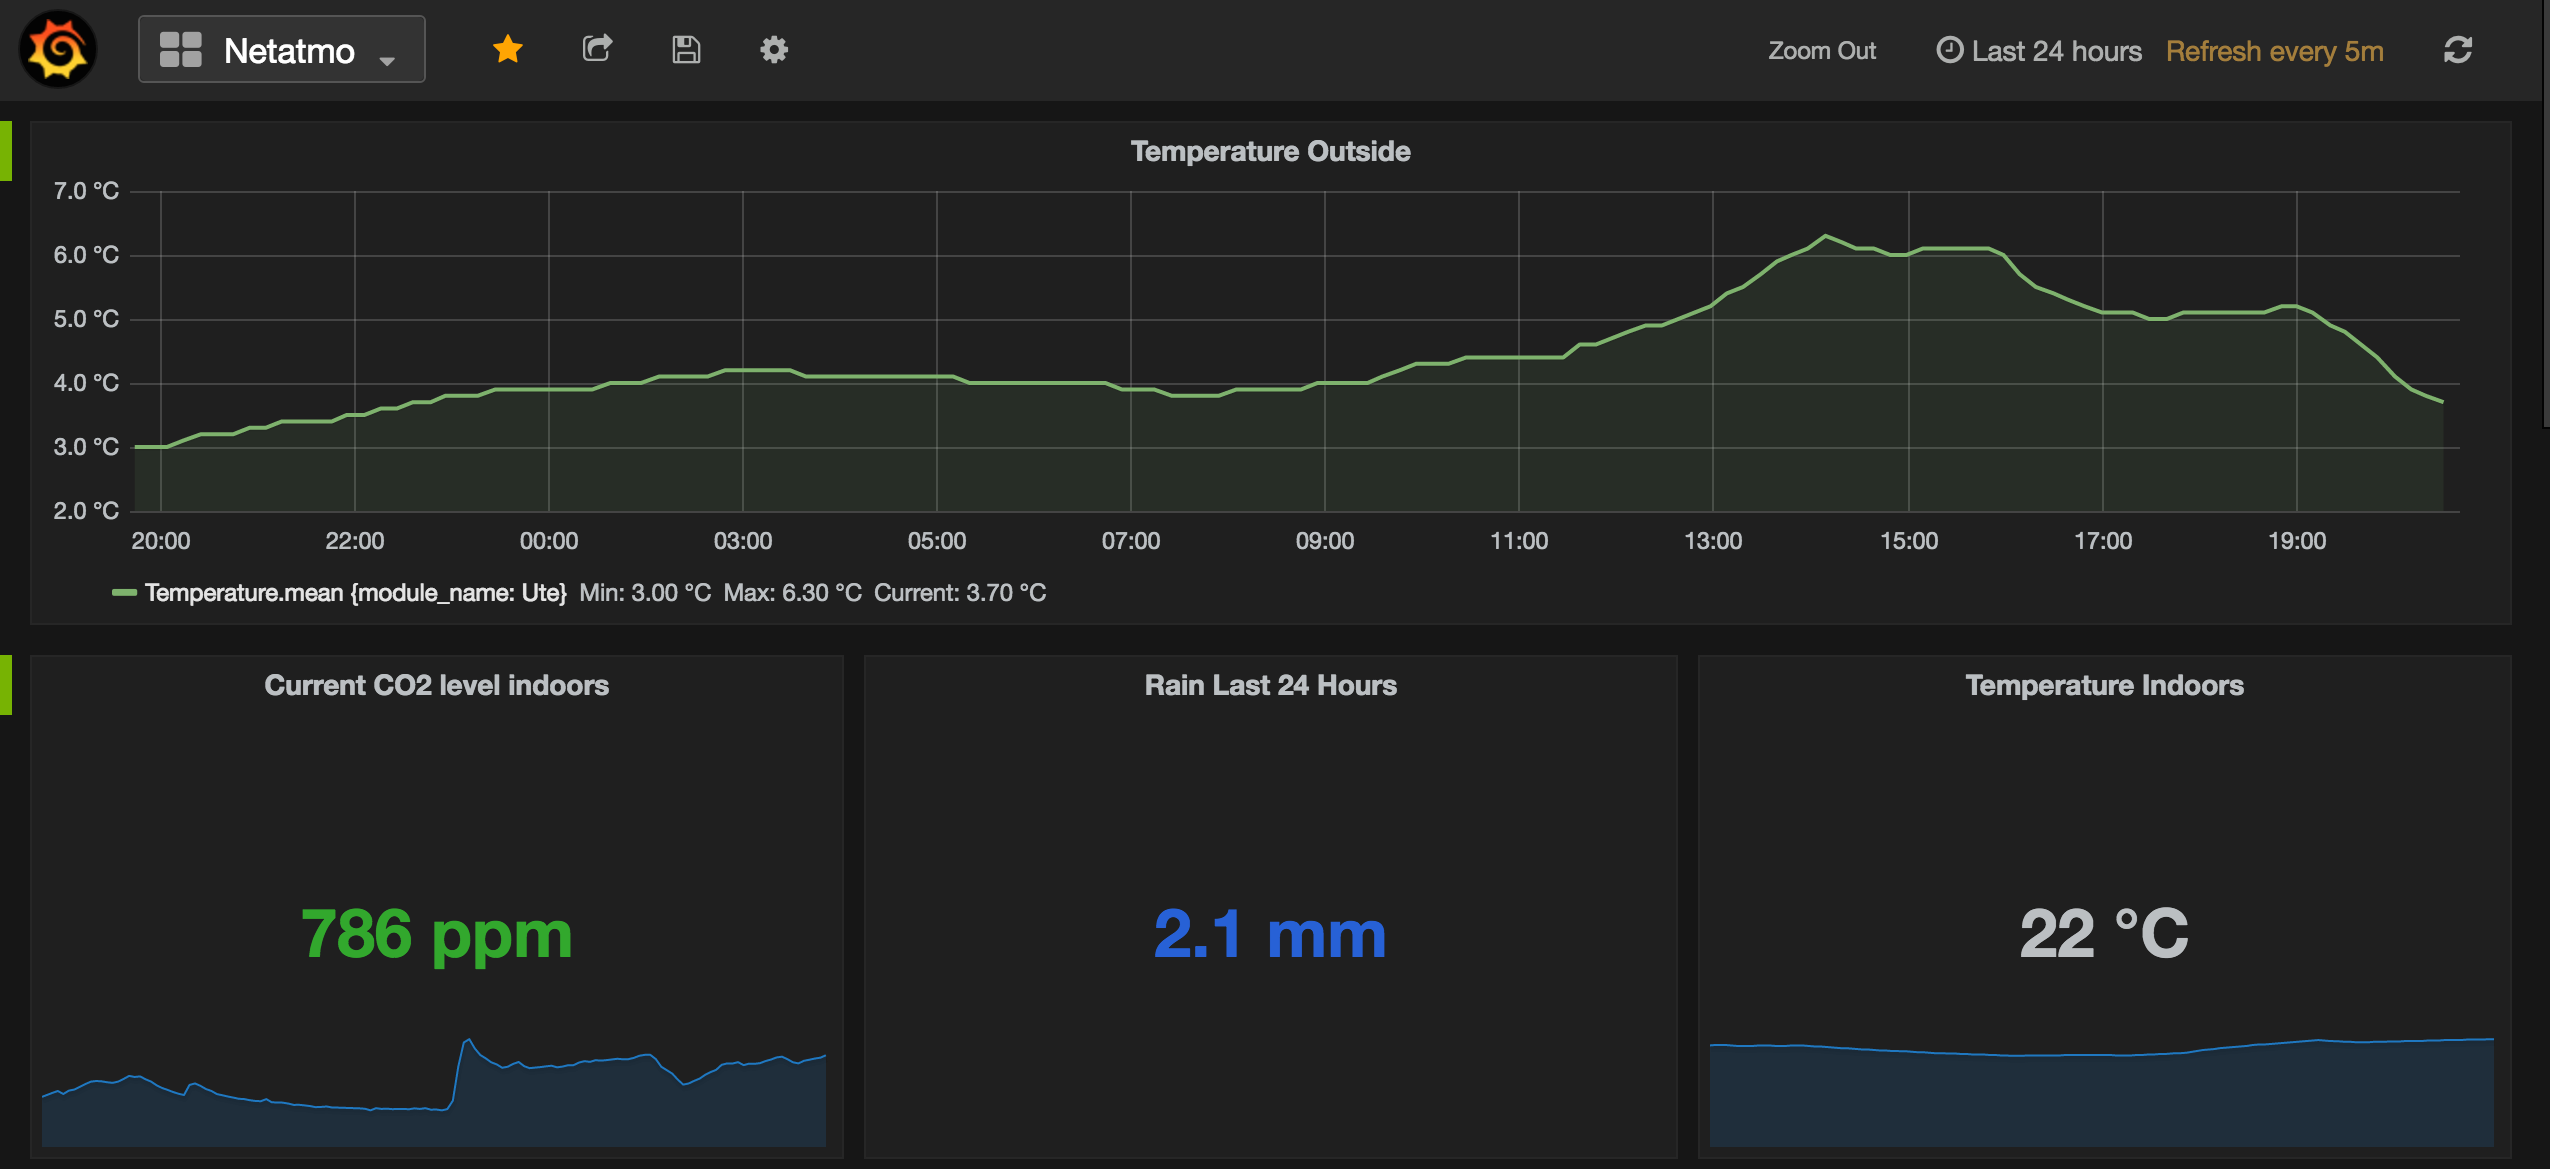
If you just want to see your Netatmo data in a beautiful dashboard, go to my free web service grafatmo.com to register for an account where the dashboard is already set up for you. And if you don’t have a Netatmo Weather Station yet but want to try anyway, create a Netatmo account and go to the publicly available Netatmo HQ station in Paris to associate the station with your account.

To get started with Grafana on your own server or laptop, the first thing to do is to get access to measurement data from your Netatmo station. Register for developer access at Netatmo to get that. After creating an account, continue to “Create an App” to get the necessary client ID and client secret.
Authentication and tokens
Using the client credentials, there are basically two modes of authentication, an easy one and a more complicated one. The easy one is called Client Credentials in the Netatmo docs and gives you an OAuth2 access token in just one step. Just send a request to the Netatmo API with your client credentials and your Netatmo username+password to get a token. The access token is then used in API calls to get measurement data for your station. The more complicated method is called Authorization Code and makes it possible for your application (“client”) to request access to other Netatmo weather stations than your own by redirecting the owner of that station to an OAuth2 authorization webpage.
Using Python, the following code issues a POST request for an access token the easy way. Before running it, replace the NETATMO_* constants with your values for client ID, client secret, username and password.
 data = dict(grant_type='password', client_id=NETATMO_CLIENT_ID,
        client_secret=NETATMO_CLIENT_SECRET, username=NETATMO_USERNAME,
        password=NETATMO_PASSWORD, scope='read_station')

 resp = requests.post('https://api.netatmo.com/oauth2/token', data=data)
 if resp.status_code == 200:
     token = resp.json()
     token['expiry'] = int(time.time()) + token['expires_in']
Now you have a “token” variable as a dictionary with several fields.
The returned token data comes with an expires_in field that says how many seconds the token is valid. In the last line above I transform that into an expiry field containing the unixtime of expiry. That’s necessary to be able to check periodically if the token needs to be refreshed. Here is an example of a token dictionary including the additional expiry field:
{
  u'access_token': u'abcdefgh|1234567890',
  u'expire_in': 10800,
  u'expires_in': 10800,
  u'expiry': 1468168541,
  u'refresh_token': u'ababababab|2727272727',
  u'scope': [u'read_station']
}
When the expiry time gets close, the refresh_token is used to renew the access_token by issuing another POST request:
data = dict(grant_type='refresh_token', refresh_token=token['refresh\_token'], client_id=NETATMO_CLIENT_ID, client_secret=NETATMO_CLIENT_SECRET)
resp = requests.post('https://api.netatmo.com/oauth2/token', data=data)
if resp.status_code == 200:
    token = resp.json()
    token['expiry'] = int(time.time()) + token['expires_in']
Measurement JSON data format
With a valid access_token we can fetch the interesting measurements from Netatmo. The APIs contain several methods for different Netatmo products, but for the Weather Station only /api/getstationdata is needed. Issue a GET request to see all the available measurements:
resp = requests.get('https://api.netatmo.com/api/getstationsdata?access_token=' + token['access\_token'])
if resp.status_code == 200:
    data = resp.json()
The data structure returned has a lot of fields and varies by the number of extra modules attached to your Netatmo station (and even more if you’ve connected more than one station to your Netatmo account, like the public Netatmo HQ station in Paris). Here’s an excerpt of data returned in JSON format:
{u'body':
  {u'devices':
    [{u'_id': u'70:ee:aa:bb:cc:dd',
      u'co2_calibrating': False,
      u'dashboard_data':
        {u'AbsolutePressure': 985,
        u'CO2': 431,
        u'Humidity': 46,
        u'Noise': 37,
        u'Pressure': 1001.9,
        u'Temperature': 26.3,
        u'date_max_temp': 1468101837,
        u'date_min_temp': 1468125907,
        u'max_temp': 26.7,
        u'min_temp': 24.8,
        u'pressure_trend': u'stable',
        u'temp_trend': u'stable',
        u'time_utc': 1468157806},
      u'data_type':
        [u'Temperature',
        u'CO2',
        u'Humidity',
        u'Noise',
        u'Pressure'],
...
      u'modules':
        [{u'_id': u'02:00:aa:bb:cc:dd',
          u'dashboard_data':
            {u'Humidity': 52,
            u'Temperature': 22.8,
            u'date_max_temp': 1468127398,
            u'date_min_temp': 1468115964,
            u'max_temp': 26,
            u'min_temp': 9.9,
            u'temp_trend': u'down',
            u'time_utc': 1468157799},
          u'data_type':
            [u'Temperature',
            u'Humidity'],
...
The dashboard_data section has the actual readings, while data_type informs us of the measurement types that this station reports. Values are reported in the unit the user selected on setup, meaning they could be Fahrenheit instead of Celcius for instance. A separate user part of the returned JSON has details about which units are used.
In addition to the data from the indoor Weather Station, stations also have a modules parameter which holds measurements from all connected modules (outdoor module, rain gauge, wind gauge and so on). As seen above, for each module the JSON fields are the same as for the station, with the measurements in dashboard_data and reported measurements in data_type. This greatly simplifies parsing of the JSON response, as you can use the same code for parsing the devices list as for each entry in the modules list.
Storing data in InfluxDB
InfluxDB is a time series database with high performance, good compression and an easy-to-use write API and query language. After installing and starting it up with default config options, it’s ready to use as a data store for time-series data like weather measurements. The write API is available through HTTP. To write to InfluxDB, issue POST requests with the actual data as newline-delimited strings in the body of the request. InfluxDB documentation refers to this as the line protocol. An example write request can look like this:
payload = """
Humidity,station_name=MyStation,module_name=Outdoors value=52 1468157799
Temperature,station_name=MyStation,module_name=Outdoors value=22.8 1468157799
Rain,station_name=MyStation,module_name=Rain_Gauge value=0 1468157799
"""

resp = requests.post('http://localhost:8086/write?precision=s&db=netatmo', data=payload)
This will save three measurements into time series named Humidity, Temperature and Rain in database netatmo. The value field is the actual measurement and the timestamp is from the time_utc field alongside the measurements. It’s trivial to convert the returned JSON into the line format that InfluxDB expects.
The station_name and module_name are custom tags attached to the time series to make it possible to distinguish between different stations and modules. The tags are available for filtering in Grafana using WHERE statements. Station names and module names defined when setting up the Netatmo Weather Station are available in the returned JSON from the Netatmo API.
Setting up a Grafana dashboard
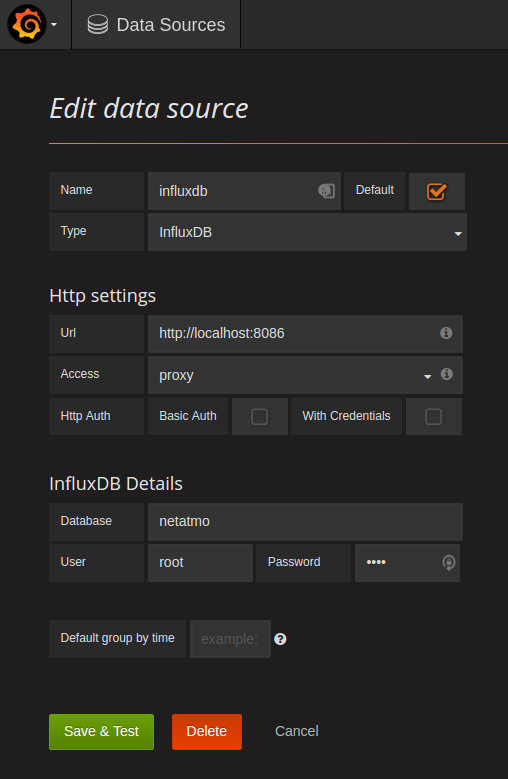
After downloading and installing Grafana, go to the Datasource part of the web UI and create a new data source with the following settings:

The User and Password under InfluxDB Details are root/root, but are not really used unless InfluxDB authentication was configured with non-default settings before starting up the database.
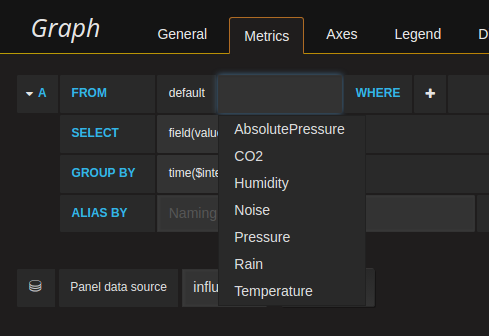
With a data source in place, the next step is to create a dashboard. There are many ways to visualize weather data, but at least add graphs for each time series you’ve stored in InfluxDB. That way you get a feel for how the metric changes over time. For some metrics the trends are most interesting, for other metrics only the current value is necessary to display. If everything works as expected, you should get suggestions when you set up the metric queries in Grafana, like this:

Under the WHERE section you can filter on tags associated with each time series, like for example the module name to only get outdoor temperatures instead of both indoor and outdoor.
Awesome visualizations
With Grafana and InfluxDB set up to store data from your Netatmo Weather Station, you can create some pretty awesome visualizations. Like for instance this outdoor temperature graph over several months, with a moving_average() layered on top:

This makes it easy to see that the temperature moved in the right direction during these months, and that there were some periods with higher average temperature than others (the two first weeks of May in particular).
If you’re interested in more awesome visualizations of Netatmo Weather Station data, head over to my web service grafatmo.com to get your own personalized weather dashboard!
~ Arne ~