Netatmo Weather Station is the ultimate personal weather station and gives you access to your measurements both through apps and a slick web interface. In addition to that, Netatmo has Developer APIs for access to raw data. Owning a Netatmo station, I just had to try to set up a Grafana dashboard with my weather data. Grafana is both flexible and has great-looking dashboards, so it should be a good fit for weather measurements. Keep on reading for tips on how to do this yourself too!
If you just want to see your Netatmo data in a beautiful dashboard, go to my free web service grafatmo.com to register for an account where the dashboard is already set up for you. And if you don’t have a Netatmo Weather Station yet but want to try anyway, create a Netatmo account and go to the publicly available Netatmo HQ station in Paris to associate the station with your account.
To get started with Grafana on your own server or laptop, the first thing to do is to get access to measurement data from your Netatmo station. Register for developer access at Netatmo to get that. After creating an account, continue to “Create an App” to get the necessary client ID and client secret.
Authentication and tokens
Using the client credentials, there are basically two modes of authentication, an easy one and a more complicated one. The easy one is called Client Credentials in the Netatmo docs and gives you an OAuth2 access token in just one step. Just send a request to the Netatmo API with your client credentials and your Netatmo username+password to get a token. The access token is then used in API calls to get measurement data for your station. The more complicated method is called Authorization Code and makes it possible for your application (“client”) to request access to other Netatmo weather stations than your own by redirecting the owner of that station to an OAuth2 authorization webpage.
Using Python, the following code issues a POST request for an access token the easy way. Before running it, replace the NETATMO_* constants with your values for client ID, client secret, username and password.
data = dict(grant_type='password', client_id=NETATMO_CLIENT_ID, client_secret=NETATMO_CLIENT_SECRET, username=NETATMO_USERNAME, password=NETATMO_PASSWORD, scope='read_station') resp = requests.post('https://api.netatmo.com/oauth2/token', data=data) if resp.status_code == 200: token = resp.json() token['expiry'] = int(time.time()) + token['expires_in']
Now you have a “token” variable as a dictionary with several fields.
The returned token data comes with an expires_in field that says how many seconds the token is valid. In the last line above I transform that into an expiry field containing the unixtime of expiry. That’s necessary to be able to check periodically if the token needs to be refreshed. Here is an example of a token dictionary including the additional expiry field:
{u'access_token': u'abcdefgh|1234567890', u'expire_in': 10800, u'expires_in': 10800, u'expiry': 1468168541, u'refresh_token': u'ababababab|2727272727', u'scope': [u'read_station']}
When the expiry time gets close, the refresh_token is used to renew the access_token by issuing another POST request:
data = dict(grant_type='refresh_token', refresh_token=token['refresh_token'], client_id=NETATMO_CLIENT_ID, client_secret=NETATMO_CLIENT_SECRET) resp = requests.post('https://api.netatmo.com/oauth2/token', data=data) if resp.status_code == 200: token = resp.json() token['expiry'] = int(time.time()) + token['expires_in']
Measurement JSON data format
With a valid access_token we can fetch the interesting measurements from Netatmo. The APIs contain several methods for different Netatmo products, but for the Weather Station only /api/getstationdata is needed. Issue a GET request to see all the available measurements:
resp = requests.get('https://api.netatmo.com/api/getstationsdata?access_token=' + token['access_token']) if resp.status_code == 200: data = resp.json()
The data structure returned has a lot of fields and varies by the number of extra modules attached to your Netatmo station (and even more if you’ve connected more than one station to your Netatmo account, like the public Netatmo HQ station in Paris). Here’s an excerpt of data returned in JSON format:
{u'body': {u'devices': [{u'_id': u'70:ee:aa:bb:cc:dd', u'co2_calibrating': False, u'dashboard_data': {u'AbsolutePressure': 985, u'CO2': 431, u'Humidity': 46, u'Noise': 37, u'Pressure': 1001.9, u'Temperature': 26.3, u'date_max_temp': 1468101837, u'date_min_temp': 1468125907, u'max_temp': 26.7, u'min_temp': 24.8, u'pressure_trend': u'stable', u'temp_trend': u'stable', u'time_utc': 1468157806}, u'data_type': [u'Temperature', u'CO2', u'Humidity', u'Noise', u'Pressure'], ... u'modules': [{u'_id': u'02:00:aa:bb:cc:dd', u'dashboard_data': {u'Humidity': 52, u'Temperature': 22.8, u'date_max_temp': 1468127398, u'date_min_temp': 1468115964, u'max_temp': 26, u'min_temp': 9.9, u'temp_trend': u'down', u'time_utc': 1468157799}, u'data_type': [u'Temperature', u'Humidity'], ...
The dashboard_data section has the actual readings, while data_type informs us of the measurement types that this station reports. Values are reported in the unit the user selected on setup, meaning they could be Fahrenheit instead of Celcius for instance. A separate user part of the returned JSON has details about which units are used.
In addition to the data from the indoor Weather Station, stations also have a modules parameter which holds measurements from all connected modules (outdoor module, rain gauge, wind gauge and so on). As seen above, for each module the JSON fields are the same as for the station, with the measurements in dashboard_data and reported measurements in data_type. This greatly simplifies parsing of the JSON response, as you can use the same code for parsing the devices list as for each entry in the modules list.
Storing data in InfluxDB
InfluxDB is a time series database with high performance, good compression and an easy-to-use write API and query language. After installing and starting it up with default config options, it’s ready to use as a data store for time-series data like weather measurements. The write API is available through HTTP. To write to InfluxDB, issue POST requests with the actual data as newline-delimited strings in the body of the request. InfluxDB documentation refers to this as the line protocol. An example write request can look like this:
payload = """ Humidity,station_name=MyStation,module_name=Outdoors value=52 1468157799 Temperature,station_name=MyStation,module_name=Outdoors value=22.8 1468157799 Rain,station_name=MyStation,module_name=Rain_Gauge value=0 1468157799 """ resp = requests.post('http://localhost:8086/write?precision=s&db=netatmo', data=payload)
This will save three measurements into time series named Humidity, Temperature and Rain in database netatmo. The value field is the actual measurement and the timestamp is from the time_utc field alongside the measurements. It’s trivial to convert the returned JSON into the line format that InfluxDB expects.
The station_name and module_name are custom tags attached to the time series to make it possible to distinguish between different stations and modules. The tags are available for filtering in Grafana using WHERE statements. Station names and module names defined when setting up the Netatmo Weather Station are available in the returned JSON from the Netatmo API.
Setting up a Grafana dashboard
After downloading and installing Grafana, go to the Datasource part of the web UI and create a new data source with the following settings:
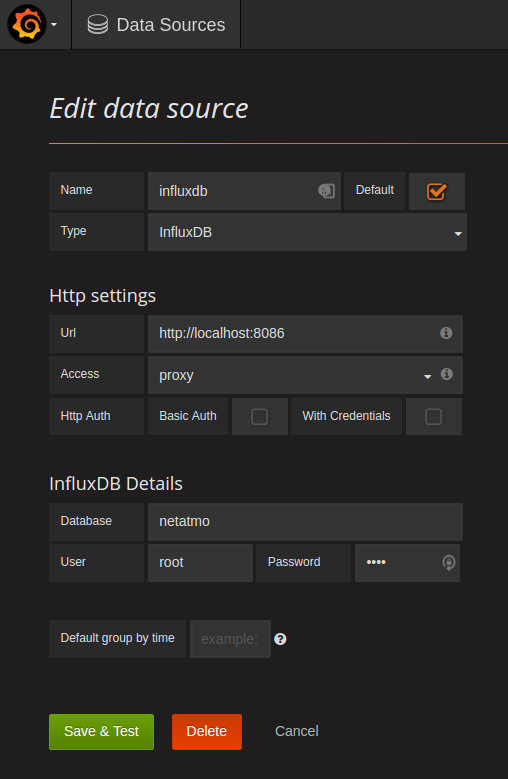
The User and Password under InfluxDB Details are root/root, but are not really used unless InfluxDB authentication was configured with non-default settings before starting up the database.
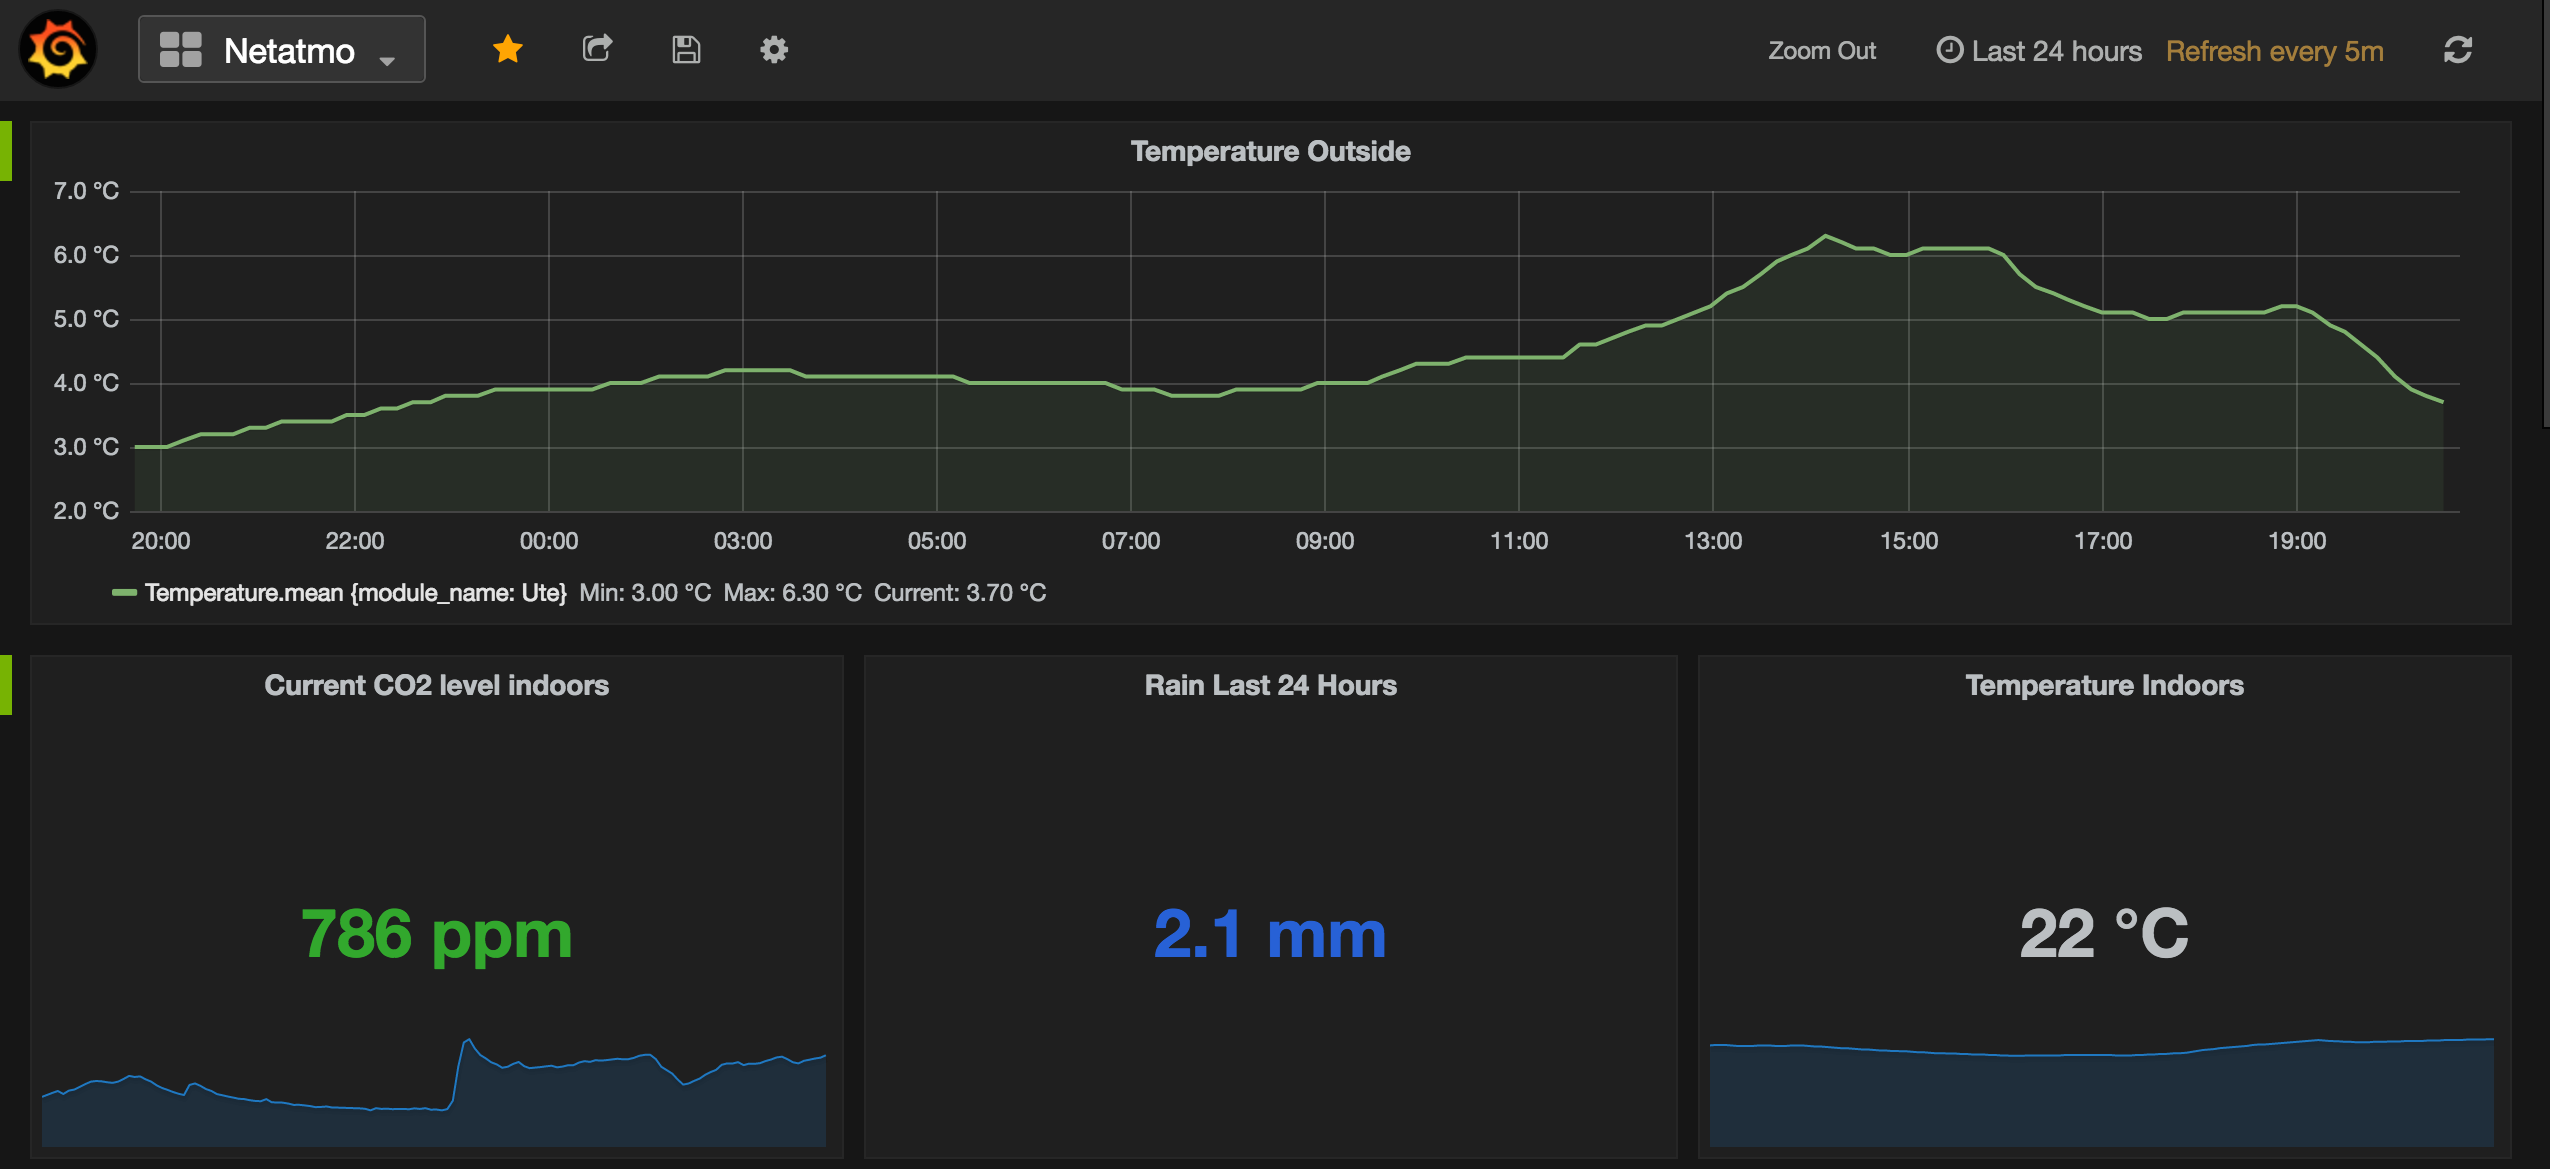
With a data source in place, the next step is to create a dashboard. There are many ways to visualize weather data, but at least add graphs for each time series you’ve stored in InfluxDB. That way you get a feel for how the metric changes over time. For some metrics the trends are most interesting, for other metrics only the current value is necessary to display. If everything works as expected, you should get suggestions when you set up the metric queries in Grafana, like this:
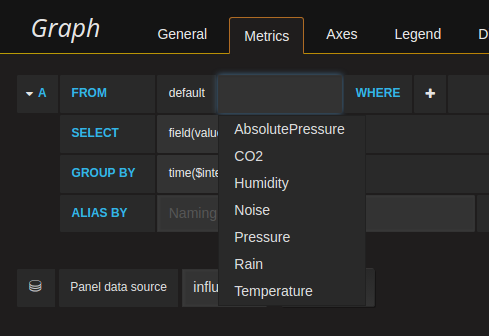
Under the WHERE section you can filter on tags associated with each time series, like for example the module name to only get outdoor temperatures instead of both indoor and outdoor.
Awesome visualizations
With Grafana and InfluxDB set up to store data from your Netatmo Weather Station, you can create some pretty awesome visualizations. Like for instance this outdoor temperature graph over several months, with a moving_average() layered on top:
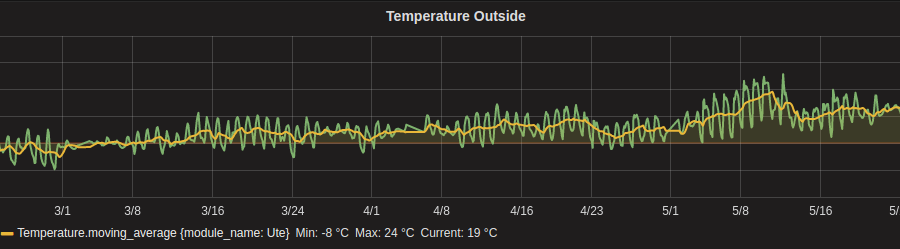
This makes it easy to see that the temperature moved in the right direction during these months, and that there were some periods with higher average temperature than others (the two first weeks of May in particular).
If you’re interested in more awesome visualizations of Netatmo Weather Station data, head over to my web service grafatmo.com to get your own personalized weather dashboard!
~ Arne ~
Hi Arne – I’m interested in getting this to work with my Netamo set up. I followed your link to your weather dashboard to by only get to a log in page. Is this still something you have open? PS. I’m a complete novice with all this – so any basic instructions would be helpful too. Thanks
LikeLike
Hi! Thanks for the interest! The GrafAtmo setup is operational for existing users, but the register-function for new users is currently down. I’ll fix that and let you know when it’s open for new users again. Regards, Arne
LikeLike
The register function is now back online! Go to http://www.grafatmo.com to initiate the signup, which starts with a redirect to Netatmo to approve access. Enjoy!
LikeLike
that looked quiet complicated… is there a description on the web where i can see that step by step? 😛
have a website for my netatmo and it would be great with some graphs
LikeLike
Hi! There are certainly several steps to complete to get this up and running on your own server. Let me know if any specific part needs more details. You can always start by going to https://grafatmo.com/ and get graphs for your Netatmo data first 🙂 ~Arne~
LikeLike
Hi Arne, jeg har sjekket grafatmo.com og fikk det til å fungere med min stasjon. Veldig fint oppsett :). Jeg har begynt å sette meg inn i det du skrev ovenfor, men tror jeg er litt for håpløs til å få dette til med mine datakunnskaper :P. Men i og med at grafatmo fungerer allerede viser jo det at mine stajonsdata er tilgjengelige i grafana.
Men jeg har også en vindmåler som jeg gjerne skulle bygd inn i dashbordet. Så er spørsmålet – siden det datenbanktekniske synes å fungere – om det er mulig for meg å kunne tilpasse dashbordet du har utviklet og implementere noen av grafene på min værside…
Hilsen,
Stefan
LikeLike
Hei!
Takk for hyggelige kommentarer! Jeg har tenkt på å åpne opp for redigering av grafene, og skal få aktivert det. Jeg har også vindmåler og har allerede laget støtte for den, så det skal være enkelt å få grafer på vind også. Sier fra når det er på plass.
Det å gjøre grafene tilgjengelig på egen værside er en spennende ide! Skal sjekke hvordan det kan løses enklest mulig.
Hilsen Arne
LikeLike
Hei igjen,
Ja, det hadde vært supert :D. Nettopp fått meg vindmåler og holder på med å lage en WordPress side der jeg integrerer dataene.
Men “historien” hadde vært fint å fremstille med grafer. Så er det dataene fra innestasjonen som ikke bør ligge åpent på nettet. Jeg har lest litt på nettet, men helt alene klarer jeg nok ikke å sette opp en server med influxDB :P.
Skal også integrere et IP camera. Så det blir artig å lansere siden om ikke så lenge :).
Hilsen,
Stefan
LikeLiked by 1 person
Hi i m login my netatmo account api authorization but after have login page grafana login and password. what login and password to see dashboard ? thx 🙂
LikeLike
Hi! There was unfortunately a bug in the GrafAtmo registration system, but that’s fixed now. I sent you an email with the necessary details to complete signup. ~Arne
LikeLike
Hi,
Thanks for your article.
Would you like to share your python files so that I can reproduce the setup and use directly in my Grafana dashboard?
Unfortunately, I am not proficient enough in Python in order to be able to make it work with only some snippets you gave.
LikeLike
Hi Denis!
Sorry for the late reply! The Python code I run to power Grafatmo.com is highly customized for that use-case (hosted, multi-user data collection) and not suitable for sharing. What parts of the code are you struggling with? If you get to the point where you have a loop running that queries Netatmo and saves to InfluxDB, you should be good. I’m happy to help getting the code to that stage.
~ Arne
LikeLike
Hi! I have some problem’s with setting up the python code for my self. As i am running an own Grafana server i would like to parse the data self instead of using the one from you.
Right now after some digging i got the following:
Traceback (most recent call last):
File “token.py”, line 17, in
data = dict(grant_type=’refresh_token’, refresh_token=token[‘refresh_token’], client_id=’xxxx’, client_secret=’xxx’)
NameError: name ‘token’ is not defined
As i am no way an expert in Python it’s somehow dificult to solve this one. Please could you help?
Thank you
-Jeroen
LikeLike
Hi! The error message says the variable “token” is not set. Check if you have code before line 17 that sets that variable. If not, you are missing a piece of the puzzle.
~Arne
LikeLike
Hi, I am not a developer at all so writing the actual application to get the data into influxDB is a big hurdle. Could you share the python code / application to get the data into influxDB? The rest is not an issue (as I have Grafana and influxDB already running and graphing) . Thanks!
LikeLike
Hi!
The blog post has most of the required pieces for you to put together into a script, but the part about parsing the JSON measurement data and posting the data points to InfluxDB is missing. So I created the following example script to give you a head start: https://gist.github.com/arnesund/29ffa1cdabacabe323d3bc45bc7db3fb
Please note that the script doesn’t do error handling and there’s a lot of if-statements without an else-clause. That is stuff you can add as you run this for a while and see what kind of errors typically occur.
~ Arne
LikeLike
Thanks! This seems to fetch data. I presume you run this in a cron?
LikeLike
This script runs a continuous loop until you stop it, so it’s not suitable for cron. Launch it in a screen for testing or create a small Upstart/SystemD job for it to run it all the time.
LikeLike
Oh ermm it only seems to fetch data of 1 station (correct me if I’m wrong) But I have 3.
LikeLike
There is a loop “for device in …” that makes sure to save all measurements for all stations you have. You should be able to see them all in the debug output it prints.
LikeLike
Sorry , I meant modules. Do you think it is possible to get data from 3 modules in 1 station? I have 2 indoor and 1 outdoor module.
LikeLike
Yes, that’s no problem. The example script has a loop “for module in …” for that purpose. It can handle multiple stations that each have multiple modules. Did you get it to run and check whether your modules are listed in the debug output? There are some corner cases which might need handling, like if the module names have commas in them.
LikeLike
I got the script to run and put data in influxdb. It only puts data of 1 module in the databases though. The main module, hence my question. Weird thing too is when I run the script from cmdline it errors. But when I run it in the background it seems to work.
root@xxxxxxxx:~# /usr/local/scripts/fetch_netatmo.py
Will write measurements to InfluxDB at endpoint http://localhost:8086/write?precision=s&db=netatmo
Traceback (most recent call last):
File “/usr/local/scripts/fetch_netatmo.py”, line 32, in
if token[‘expiry’] – int(time.time()) < 600:
NameError: name 'token' is not defined
Running it like this:
nohup /usr/local/scripts/fetch_netatmo.py &
seems to put data in the database …
LikeLike
That error means there was some problem getting an authentication token from Netatmo. You can get the initial measurements with just a username and password, but after a short while that doesn’t work anymore. First step is to double check that your Netatmo client ID and client secret values are correct.
LikeLike
Hmm now it just stopped working all together….
LikeLike
Got it to work again. Thanks for the token hint. A more detailed look seems to reveal that module measurements are being done but all under the same module name …
LikeLike
Ah, you’re right. There was a bug on line 54, “modulename = device[‘module_name’]” should be “modulename = module[‘module_name’]”. I updated the public gist with this single bugfix now. Thanks for noticing!
LikeLike
Thanks for sticking with me and thanks for the script!
LikeLike
🙂
LikeLike
Hi is it also possible to read WIFI strenght and Battery status and put that in the database using the script?
LikeLike
Yes, the returned measurements contain those values as well. Add a print(data) right after “data = resp.json()” to see the full contents of measurements and figure out the names of the fields. What you need to do is add more “payload += …” lines containing the fields you want to save.
~ Arne
LikeLike
Thanks I will look into it.
LikeLike
Hi
I’ve been using grafatmo for a few weeks and it worked fine. But now it seems that it has lost connection to netatmo because I only get N/A-Values. Is there any way to restore that connection or do I need to setup a new account?
Thanks.
dabbax
LikeLike
Hi! Thank you for reporting this. Please send an email to support@grafatmo.com with your Grafatmo username and we’ll look into it. Thanks!
LikeLike
ok will do. Thanks for the fast reply
LikeLike
Remeber the script you put on Github? I think its broken. I get this error:
Will write measurements to InfluxDB at endpoint http://localhost:8086/write?precision=s&db=netatmo
Traceback (most recent call last):
File “fetch_netamo_data.py”, line 32, in
if token[‘expiry’] – int(time.time()) < 600:
NameError: name 'token' is not defined
Is this fixable or is there something else going on?
LikeLike
NM found it
LikeLike
Still not able to add the battery and wifi status of my Netatmo modules (dont know how)
LikeLike
it’s still working..?
can i use grafana with module thermostat also to check the data?
LikeLike
Hi! The service only works for Netatmo Weather Station data, not thermostat or any of the other Netatmo products.
LikeLike
Is there an easy way to grab the minimum and maximum values from the graph displays so that I can make a separate tile with the values in large numbers (to see easily from say wall mounted tablet)?
LikeLike
Hi! Yes, that’s straightforward. Add a panel of type Singlestat and use a query that looks something like this:
SELECT max(“value”) FROM “Temperature” WHERE (“module_type” = ‘Outdoor’ AND “station_name” =~ /^$station$/) AND $timeFilter GROUP BY time($__interval) fill(null)
The important part is to select max() or min() in the beginning of that query to get the value you’re after. You probably have to switch edit mode of the query to be able to copy-paste the query above into Grafana.
LikeLike
Got it!–I had entered a query like you showed to me to get the max value for the temperature but it was still displaying the current temperature–then I realized that you also have to change the “stat” setting from the default “current” to “max” on the Visualization page settings for the Singlestat. Thanks for the help. I love Grafatmo. I have it setup on a Fire Tablet to clearly display my weather data all the time in the kitchen.
LikeLike
Awesome! That’s great to hear. Good work figuring out the additional stat setting, I overlooked that part in my testing of the query.
LikeLike