Performance Benchmarking Local LLMs on Macbook Pro M3 Pro
I love tinkering with LLMs and have been following /r/LocalLlama for a while. I’ve been a Linux user for as long as I can remember, but Apple with their M-series processors are too good to pass up when it comes to running LLMs locally. So when it was time to get a new laptop, I was very excited to be able to get a Macbook Pro with M3 Pro!
Up until now I’ve been running local LLMs on my desktop with a Nvidia RTX 2070 Super GPU, but with only 8 GB VRAM it can only handle the smallest models. My new Macbook Pro has 36 GB unified RAM and can handle the next class up of bigger models.
However, how many tokens can a Macbook Pro M3 Pro actually generate per second? And how fast does it load a model? That’s what I set out to measure and document here.
Macbook Pro test setup
It’s important to free up as much RAM as possible to push the limits in terms of big LLMs. For this test I opted for the following test setup:
- Macbook Pro on power, fully charged
- Ollama as a service (installed using Brew), exposed over the network
- As many other apps and services shut down to conserve RAM
- Screen locked and turned off
- Macbook not allowed to go to sleep even though screen is off
- sysctl setting modified from 0 to 33000 (theoretical max is something like 36864)
Calling the LLM happens entirely over the network, calling the Ollama API. This way I don’t have to run any additional code on the Macbook itself, to measure LLM speed. However, this also makes the test a bit unrealistic.
Under normal operation you’d most likely use some app on the Macbook that is configured to talk with Ollama, like VSCode or Open WebUI etc. That usage would naturally consume some RAM, reducing the available RAM for the LLM and maybe exclude some LLMs from consideration. Keep that in mind when evaluating the results below.
LLM test setup
Each LLM is tested with three requests in a row. The first request triggers load of the model into RAM, while the two next requests reuse the model while it’s still in RAM. This is evident from the loading time metrics in the results below.
Here are the three requests that each model gets:
- No system prompt. User message: “Hi how’s it going?”.
- System prompt: “You are a fiction writer that responds in the style of Shakespeare”. User message: “Tell me a long story”.
- System prompt: “You’re a Python programming expert”. User message: “Make a Streamlit app that listens to Kafka messages and prints title and URL”.
Each request is sent to the /api/generate API endpoint exposed by Ollama. There is no history provided in the requests, meaning each request is standalone and does not include the output from the previous requests as chat history. The first request is intended to be a warmup request to get the model loaded. The other two requests are intended to get the model to generate a fair amount of tokens, making the averaged tokens/second measurement more accurate. Note that none of these requests are big, so we’re essentially benchmarking how these models do for short prompts only. Long prompts will have different performance characteristics.
This is purely a performance test so I don’t even look at the output tokens generated by each model. Quality of output is a different kind of benchmark. The main goal with these three requests is to get the model to generate a sizable amount of tokens, to see how the model and the Macbook performs for requests that take some time to answer. Loading time is also very interesting, as well as the ability to offload the entire model to the GPU.
Tokens per second
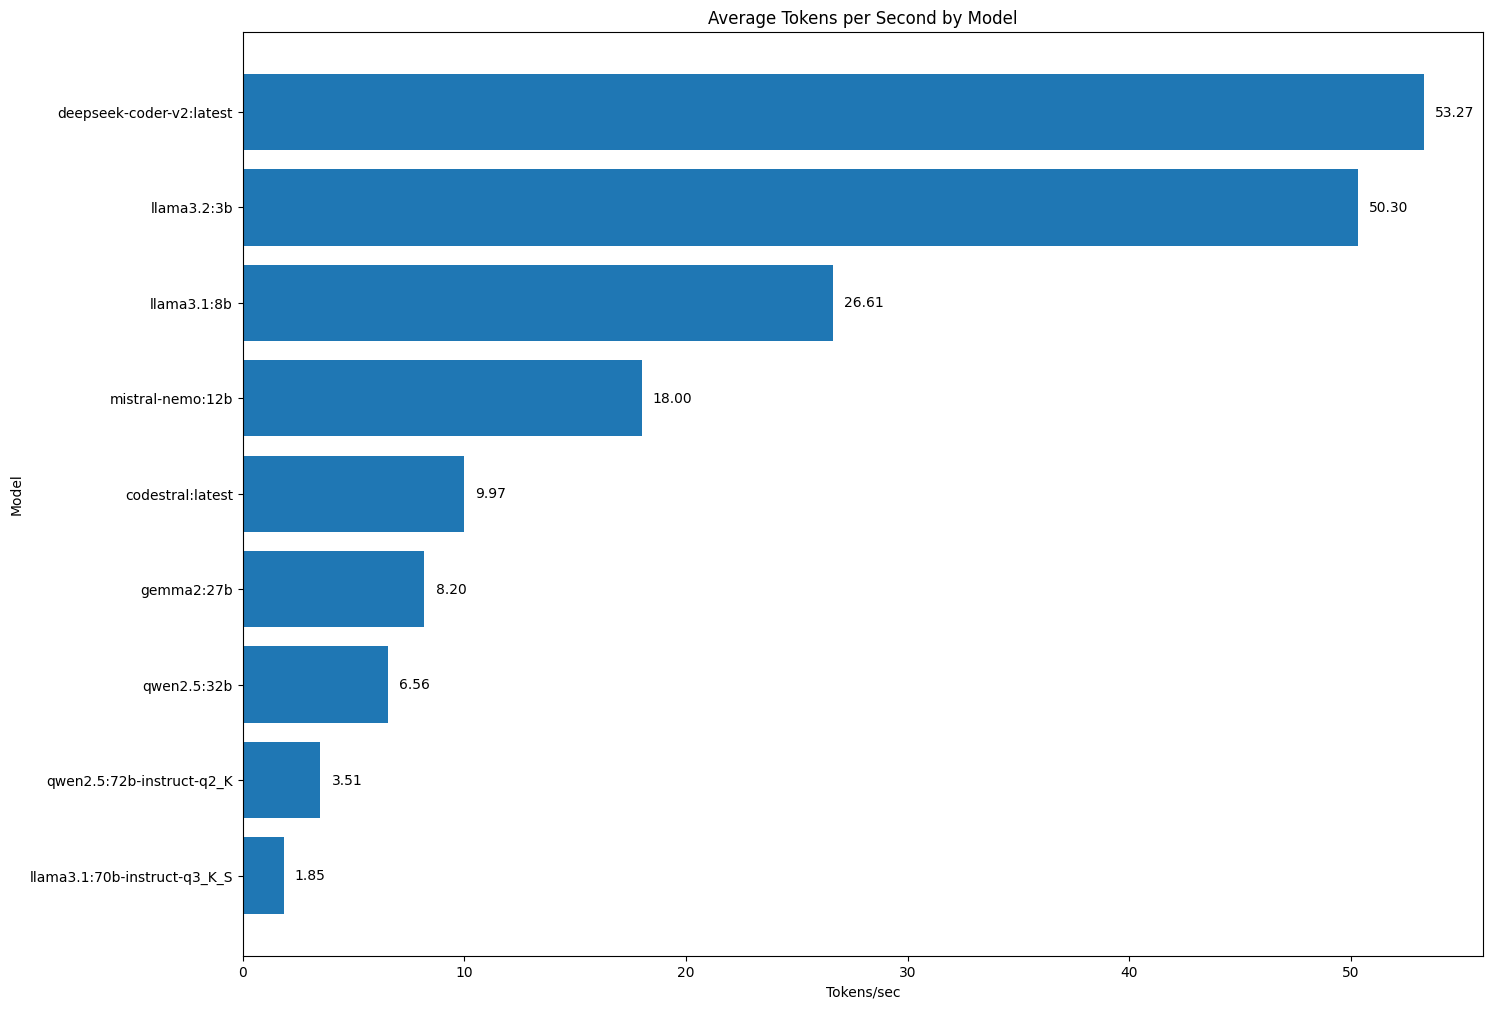
Without further ado, here are the average number of tokens/sec for the local LLMs I tested.

The big positive surprise is how fast deepseek-coder-v2 is. This is a great quality model for autocomplete when coding and that’s a use-case where speed (i.e. autocomplete latency) is paramount. The completions need to appear in the IDE before you get a chance to continue typing more characters, as those characters would invalidate the completion and make it useless.
With the exception of the 16B parameter model deepseek-coder-v2, the rest of the performance numbers follow the parameter count. Meaning that smaller models with less parameters are noticeable faster than bigger models with more parameters.
There’s no magic to the deepseek-coder-v2 results though. It is a Mixture of Experts (MoE) model where only some parts of the model are active for each token. In a regular dense LLM the entire model is active in predicting each token. It’s very interesting to see the performance effects of MoE so clearly.
Loading times
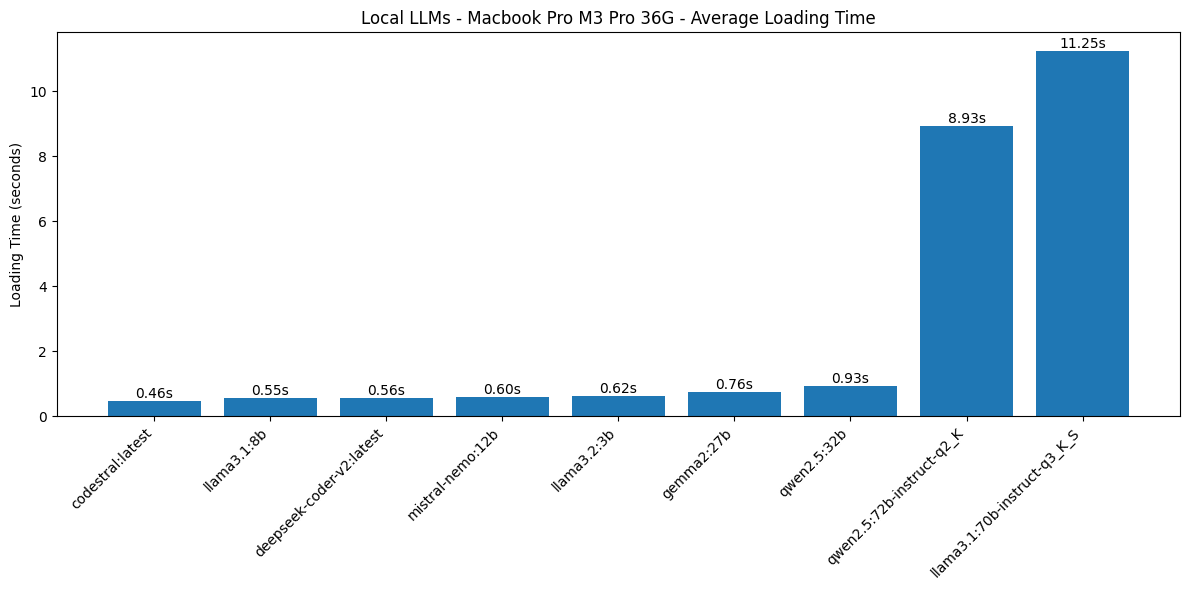
The time it takes to load the model from disk into RAM, in seconds, before it starts to process the prompt and generate output. Average over multiple performance test cycles. Smaller is better.

The two biggest models here, Llama 3.1 70B and Qwen 2.5 72B, are most likely too big for this hardware. Loading time around 10 seconds is too much. The tokens/second performance of these two models is also abysmal, which is easily explained when looking at Ollama logs and discovering that Ollama is not able to offload all layers of the LLM to the GPU.
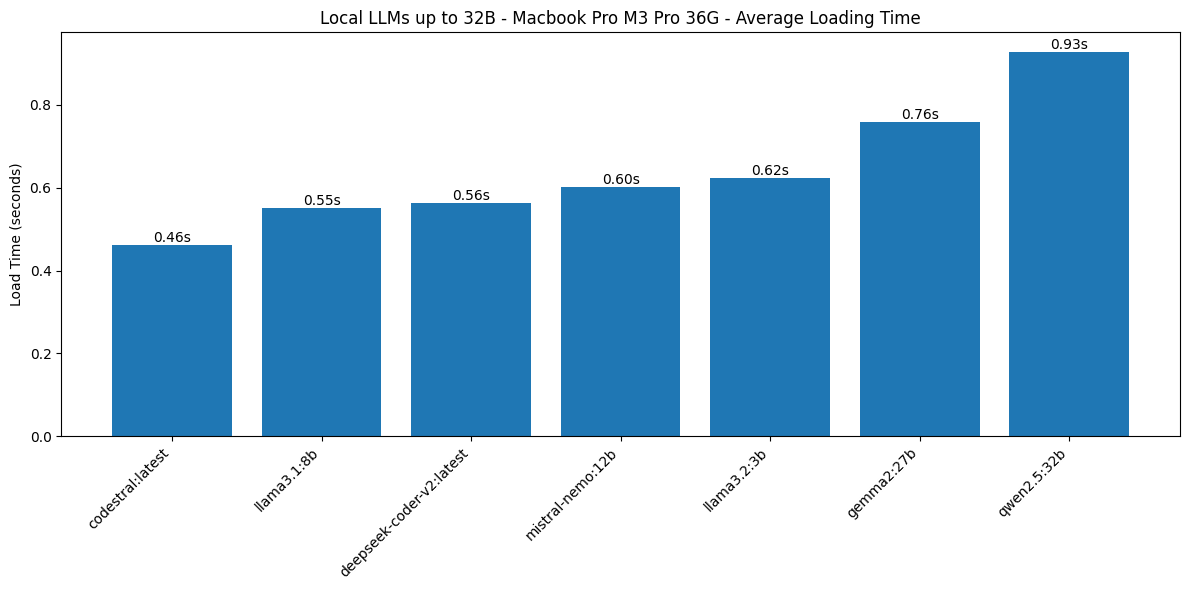
Let’s look at loading times with these two outliers removed:

There’s still a factor 2 between the fastest and the slowest of these LLMs. However, loading time below 1 second for the first request is acceptable even when using these models interactively (for chatting or autocomplete for example). I was pleasantly surprised by these results and it speaks to the bandwidth of the rest of the components in this Macbook Pro.
Fast loading matters most for occasional usage when you just need the LLM to answer something from time to time. Ollama will most likely unload the model in the meantime to save RAM, so then you incur the loading time again the next time you ask something.
Model size vs loading time
It’s very interesting to see that loading time is not heavily impacted by model size (expressed as number of parameters). This is most evident when comparing Llama 3.2 in the small 3B variant with an average loading time of 0.62s, compared to Gemma 2 in the biggest 27B variant (still 4-bit quant though) with an average loading time of 0.76s.
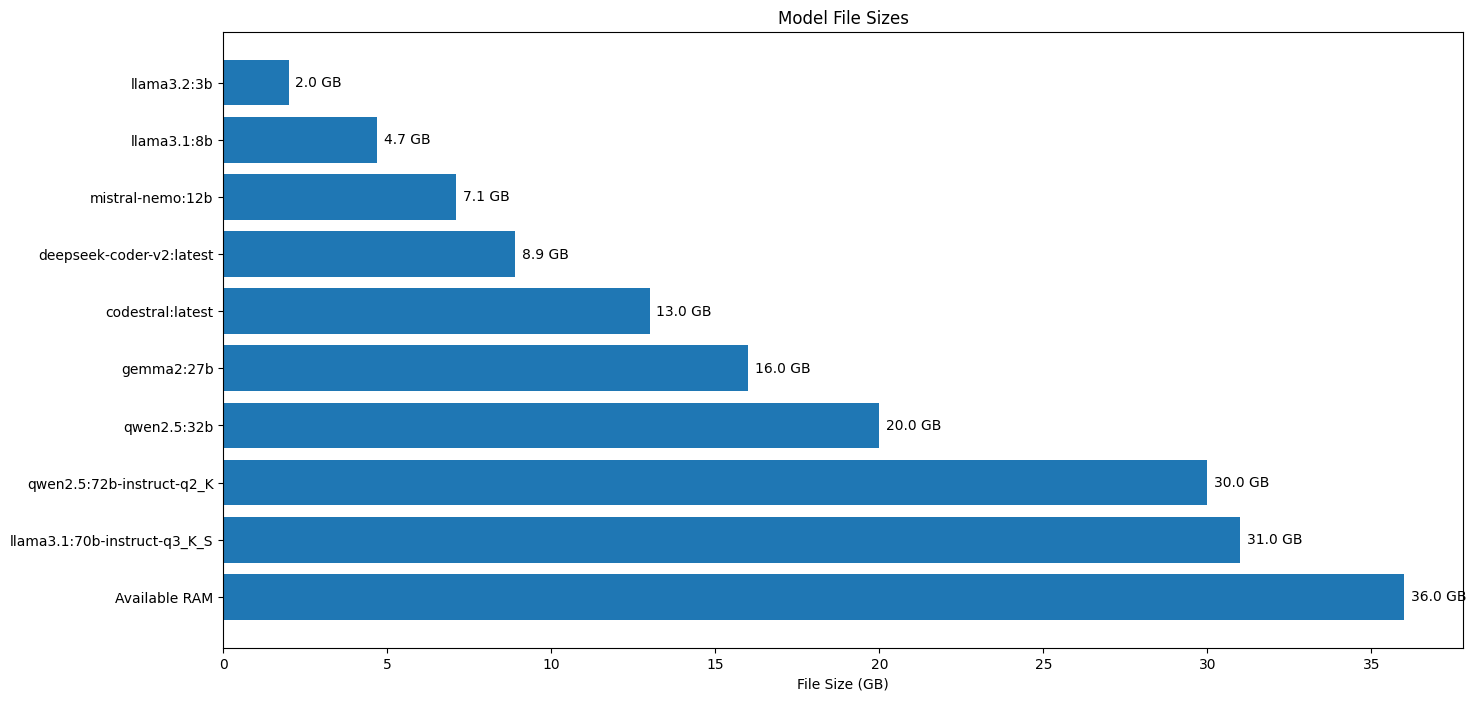
That’s a minor 22% increase in loading time for a model that has eight times more parameters. Or to put it differently, a 22% increase in loading time to load a 16 GB model instead of a 2 GB model. This tells us that most of that loading time is probably spent on initialization, not on reading data from disk into RAM.
Here’s the file size of each model, compared to the maximum available RAM as the last bar in the bar chart:

Final words
It’s great to be able to benchmark LLM performance like this. Getting a Macbook Pro has opened up a new world of possible LLMs to use locally. Local usage matters because it means the usage is free, even if you write a for-loop to query the model a lot of times for different input, like processing all your notes from Obsidian.
Local usage also means that there are no privacy concerns with using personal data in requests. With LLM API providers you always have to check whether they log your requests and whether they reserve the right to train and finetune based on those requests. If the AI provider is offering LLMs for free, most likely they’ll want to train on your data in return. Power and cooling for GPUs costs money. A local model has none of these concerns, it’s on your device that you pay the power bill for.
It’s also really cool to have a compressed copy of the Internet on your own machine!